PriceDNA Research · Mortgage payments vs. rent
Mortgage payments vs. rent: two big swings in 20 years
In 759 US counties, we compared the monthly loan payment on the middle-priced home with the middle rent, every year from 2005 to 2025 except 2020. From 2006 to 2012 the payment fell compared with rent, and from 2021 to 2024 it rose. All 759 counties had both swings, by different amounts.
- $1.43, down 45%, to $0.79the mortgage payment for each $1 of rent, 2006 to 2012. Buying got much cheaper compared with renting.
- $0.84, up 54%, to $1.30the mortgage payment for each $1 of rent, 2021 to 2024. Buying got much more expensive compared with renting.
- 759 of 759counties where that payment fell compared with rent from 2006 to 2012, and rose from 2021 to 2024
- 83%share of Americans who live in these counties
Typical means the middle. Half of Americans in these counties live where the figure is higher, half where it is lower.
The payment counts only the loan (principal and interest), not tax, insurance or upkeep. $1.30 means a $1,300 loan payment for every $1,000 of rent.
Home values come from owned homes and rents from rented ones, so this compares typical costs, not the same home.
See where your county sits today, with your own numbers →
Watch 20 years of mortgage payments and rent
Each bubble is a county, sized by its population. How far right it sits shows how much home prices have changed compared with local wages since 2000. How high it sits shows the loan payment for each $1 of rent, so a county rises when the payment grows compared with rent and falls when it shrinks. Press play to watch the counties move from 2005 to 2025. By 2025 the typical county was back near where it started: the payment was $1.28 for each $1 of rent ($1.32 in 2005), and homes cost 33% more compared with local wages than in 2000 (28% in 2005). The way back was different: first prices rose, then rates jumped.
- Northeast
- Midwest
- South
- West
- Typical county
In 2005, in the typical county, the mortgage payment on a typical home was $1.32 for each $1 of rent, and homes cost 28% more compared with local wages than in 2000. The table below the chart lists every county.
Home prices and wages are measured from 2000, before the housing boom. The chart starts in 2005, the first year the Census Bureau's yearly survey has rents.
There is no 2020 point. The Census Bureau did not release its usual yearly figures for 2020.
- The housing boomUp to 2006Prices ran ahead of local wages. In 2006, in the typical county, the loan payment was $1.43 a month for every $1 of rent. For a renter thinking of buying, the step up to owning was large.
- The bust2006 to 2012Prices fell and mortgage rates fell from 7.1% to 3.9%. It got cheaper compared with renting in every county. In the typical county, the payment for each $1 of rent fell by 45%. For a renter thinking of buying, the step up to owning got much smaller each month.
- The low-rate years2012 to 2021Prices rose faster than local wages, but mortgage rates stayed low, between 3.1% and 4.8%. The loan payment stayed lower compared with rent than in 2006, rising from $0.79 in 2012 to $0.96 at most in 2018. Tax, insurance and upkeep came on top. For a renter thinking of buying, the step up to owning stayed much smaller than in 2006.
- The rate shock2021 to 2024Rates rose from 3.1% to 6.5% and prices jumped. Buying got more expensive compared with renting in every county. In the typical county, it rose by 54%, back near its 2006 level. For a renter thinking of buying, the step up to owning got much bigger.
What the swings meant
The same swing meant different things to different people. This describes what happened, not what anyone should do.
| Period | A renter thinking of buying | An investor buying a rental | Someone who already owned |
|---|---|---|---|
| The bust 2006 to 2012: the payment fell 45% compared with rent | Moving from renting to owning got much cheaper each month. | Each $1 of typical rent covered far more of the typical loan payment. Whether a rental pays depends on its own rent and costs. | A fixed-rate payment stayed the same, while new buyers paid less. |
| The low-rate years 2012 to 2021: the payment stayed low compared with rent | The step up to owning stayed much smaller than in 2006. | Rent kept covering much more of the loan payment than in 2006. | A fixed-rate loan payment stayed the same. Rent rose, so it took a smaller share of the rent each year. Adjustable-rate payments could change. |
| The rate shock 2021 to 2024: the payment rose 54% compared with rent | Moving to owning got much more expensive each month. | Each $1 of rent had to cover about 54% more loan payment, leaving less for everything else. | Owners with low fixed rates kept them. A new buyer's payment rose; theirs did not. |
The West had the biggest swing in the payment for each $1 of rent, because it started highest: $2.19 in 2006, $1.00 in 2012 and $1.70 in 2024.
| County | State | Region | Payment for each $1 of rent | Home prices compared with local wages, change since 2000 |
|---|---|---|---|---|
| San Francisco County (San Francisco) | CA | West | $3.35 | +50% |
| Monterey County | CA | West | $3.30 | +79% |
| Marin County | CA | West | $3.12 | +30% |
| San Mateo County | CA | West | $3.04 | +63% |
| Santa Cruz County | CA | West | $2.98 | +59% |
| Napa County | CA | West | $2.94 | +67% |
| Santa Barbara County | CA | West | $2.93 | +91% |
| Santa Clara County (San Jose) | CA | West | $2.93 | +58% |
| Alameda County (Oakland) | CA | West | $2.89 | +52% |
| Kings County (New York) | NY | Northeast | $2.85 | +58% |
| Monroe County | FL | South | $2.83 | +98% |
| Los Angeles County (Long Beach, Los Angeles) | CA | West | $2.78 | +88% |
| Sonoma County | CA | West | $2.76 | +64% |
| San Luis Obispo County | CA | West | $2.71 | +72% |
| Maui County | HI | West | $2.69 | +77% |
Try it with your own numbers
The study shows the typical county. These calculators test your own situation.
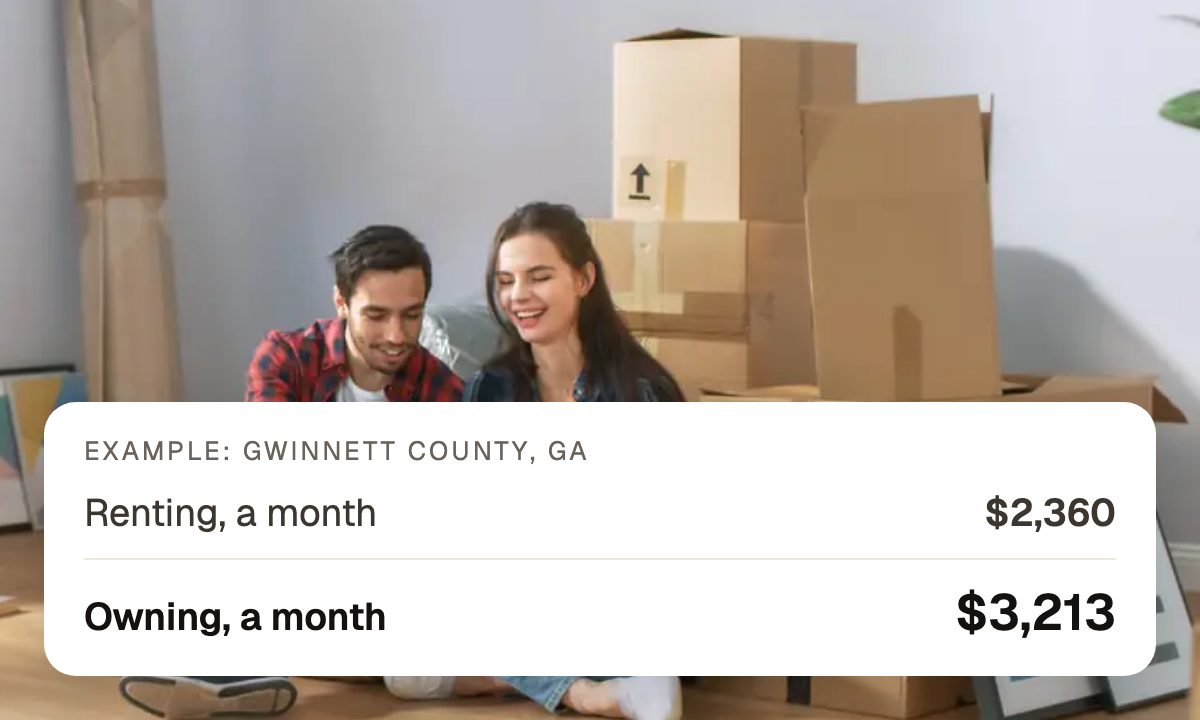 Rent or buy
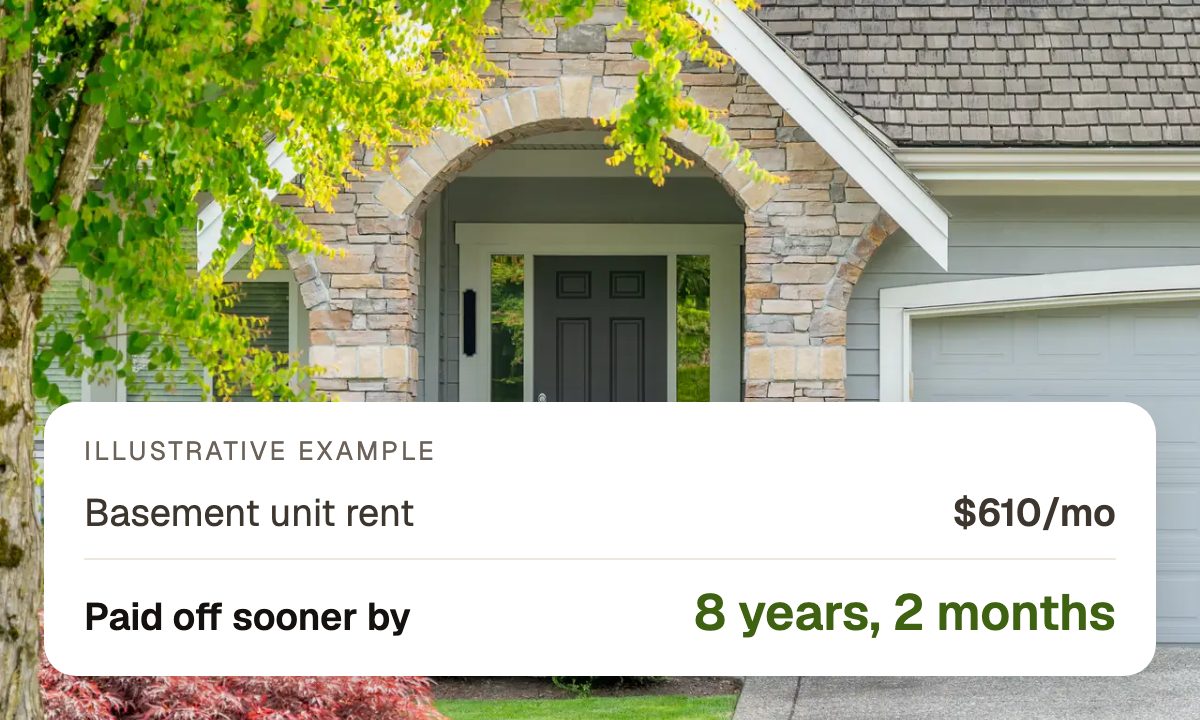 Rent out part of your home
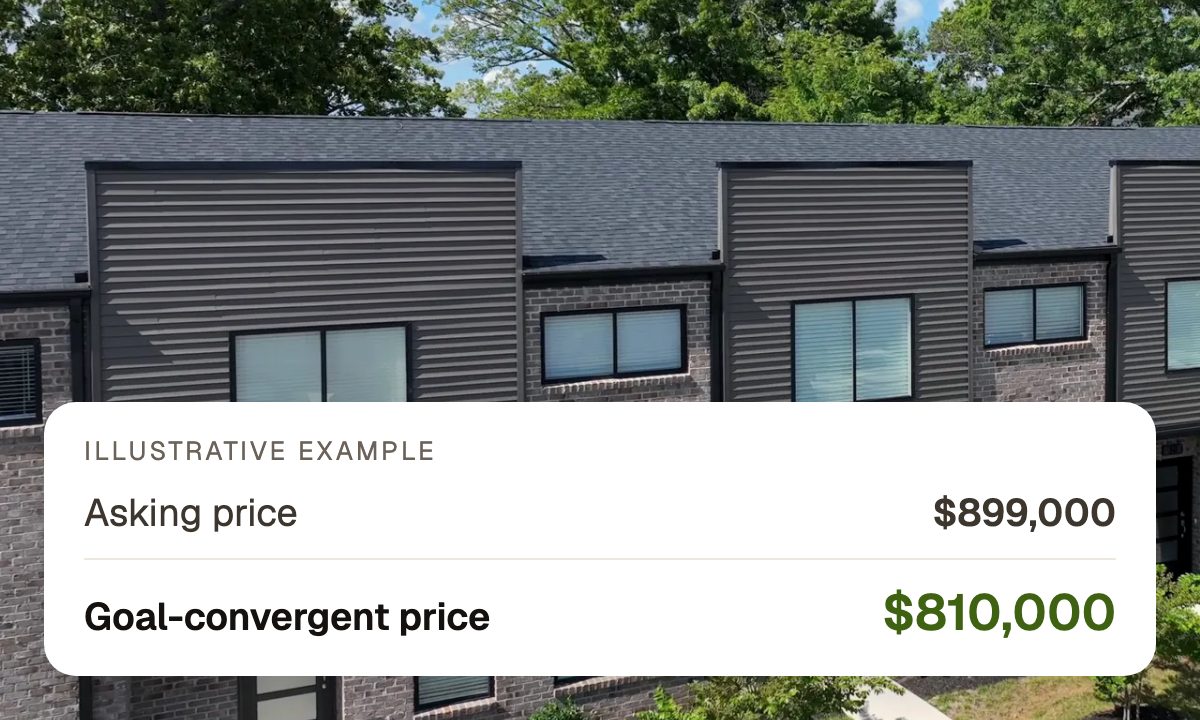 Buying a rental
How did your county change?
Search any of the 759 counties to see its path. Counties with a PriceDNA market page link to it.
| County | State | 2006 | 2012 | 2021 | 2024 |
|---|---|---|---|---|---|
| Anchorage Municipality (Anchorage) | AK | $1.48 | $0.95 | $0.89 | $1.35 |
| Fairbanks North Star Borough (Fairbanks) | AK | $1.19 | $0.67 | $0.73 | $1.08 |
| Madison County (Huntsville) | AL | $1.25 | $0.84 | $0.85 | $1.28 |
| Mobile County (Mobile) | AL | $0.93 | $0.62 | $0.60 | $0.95 |
| Pulaski County (Little Rock) | AR | $0.99 | $0.72 | $0.68 | $1.05 |
| Washington County (Fayetteville) | AR | $1.28 | $0.81 | $0.91 | $1.49 |
| Maricopa County (Chandler, Gilbert, Glendale, Mesa, Phoenix) | AZ | $1.65 | $0.70 | $0.93 | $1.34 |
| Pima County (Tucson) | AZ | $1.57 | $0.76 | $0.89 | $1.35 |
| Alameda County (Oakland) | CA | $3.12 | $1.45 | $1.62 | $2.39 |
| Fresno County (Fresno) | CA | $2.04 | $0.80 | $0.98 | $1.38 |
| Kern County (Bakersfield) | CA | $1.82 | $0.68 | $0.89 | $1.28 |
| Los Angeles County (Long Beach, Los Angeles) | CA | $3.01 | $1.31 | $1.46 | $2.18 |
| Orange County (Anaheim, Irvine, Santa Ana) | CA | $2.70 | $1.32 | $1.36 | $2.10 |
| Riverside County (Riverside) | CA | $2.13 | $0.76 | $0.99 | $1.51 |
| Sacramento County (Sacramento) | CA | $2.23 | $0.85 | $1.05 | $1.50 |
| San Diego County (Chula Vista, San Diego) | CA | $2.68 | $1.19 | $1.31 | $1.94 |
| San Francisco County (San Francisco) | CA | $3.65 | $1.90 | $2.05 | $2.75 |
| San Joaquin County (Stockton) | CA | $2.45 | $0.76 | $1.08 | $1.58 |
| Santa Clara County (San Jose) | CA | $3.13 | $1.57 | $1.77 | $2.75 |
| Arapahoe County (Aurora) | CO | $1.57 | $0.88 | $1.02 | $1.48 |
| Denver County (Denver) | CO | $1.75 | $1.10 | $1.16 | $1.72 |
| El Paso County (Colorado Springs) | CO | $1.46 | $0.87 | $0.95 | $1.39 |
| District of Columbia (Washington) | DC | $2.55 | $1.36 | $1.35 | $1.85 |
| Kent County (Dover) | DE | $1.23 | $0.79 | $0.78 | $1.18 |
| New Castle County (Wilmington) | DE | $1.46 | $0.92 | $0.84 | $1.22 |
| Duval County (Jacksonville) | FL | $1.16 | $0.57 | $0.70 | $1.06 |
| Hillsborough County (Tampa) | FL | $1.32 | $0.62 | $0.77 | $1.14 |
| Miami-Dade County (Miami) | FL | $1.76 | $0.65 | $0.86 | $1.34 |
| Orange County (Orlando) | FL | $1.41 | $0.59 | $0.75 | $1.15 |
| Pinellas County (St. Petersburg) | FL | $1.28 | $0.59 | $0.77 | $1.09 |
| Fulton County (Atlanta) | GA | $1.64 | $0.92 | $0.93 | $1.39 |
| Muscogee County (Columbus) | GA | $0.97 | $0.62 | $0.59 | $0.93 |
| Honolulu County (East Honolulu, Urban Honolulu) | HI | $2.52 | $1.43 | $1.47 | $2.27 |
| Linn County (Cedar Rapids) | IA | $1.18 | $0.84 | $0.76 | $1.24 |
| Polk County (Des Moines) | IA | $1.14 | $0.76 | $0.78 | $1.22 |
| Ada County (Boise City, Meridian) | ID | $1.57 | $0.81 | $1.18 | $1.61 |
| Cook County (Chicago) | IL | $1.73 | $0.86 | $0.79 | $1.11 |
| Kane County (Aurora) | IL | $1.51 | $0.81 | $0.79 | $1.17 |
| Allen County (Fort Wayne) | IN | $0.99 | $0.64 | $0.67 | $1.15 |
| Marion County (Indianapolis) | IN | $0.99 | $0.58 | $0.66 | $0.99 |
| Johnson County (Overland Park) | KS | $1.38 | $0.88 | $0.93 | $1.43 |
| Sedgwick County (Wichita) | KS | $0.99 | $0.67 | $0.68 | $1.10 |
| Fayette County (Lexington) | KY | $1.32 | $0.85 | $0.86 | $1.29 |
| Jefferson County (Louisville) | KY | $1.23 | $0.79 | $0.76 | $1.11 |
| East Baton Rouge Parish (Baton Rouge) | LA | $1.07 | $0.78 | $0.75 | $1.17 |
| Orleans Parish (New Orleans) | LA | $1.24 | $0.76 | $0.87 | $1.21 |
| Suffolk County (Boston) | MA | $2.07 | $1.10 | $1.19 | $1.63 |
| Worcester County (Worcester) | MA | $1.97 | $1.06 | $1.01 | $1.50 |
| Baltimore city (Baltimore) | MD | $0.95 | $0.64 | $0.57 | $0.92 |
| Howard County (Columbia) | MD | $2.02 | $1.07 | $1.00 | $1.47 |
| Androscoggin County (Lewiston) | ME | $1.32 | $0.83 | $0.82 | $1.36 |
| Cumberland County (Portland) | ME | $1.63 | $0.97 | $0.99 | $1.48 |
| Kent County (Grand Rapids) | MI | $1.25 | $0.68 | $0.78 | $1.22 |
| Wayne County (Detroit) | MI | $1.04 | $0.39 | $0.55 | $0.84 |
| Hennepin County (Minneapolis) | MN | $1.72 | $0.93 | $0.91 | $1.35 |
| Ramsey County (St. Paul) | MN | $1.61 | $0.85 | $0.85 | $1.24 |
| Jackson County (Kansas City) | MO | $1.02 | $0.60 | $0.65 | $1.00 |
| St. Louis city (St. Louis) | MO | $1.06 | $0.61 | $0.68 | $1.01 |
| Harrison County (Gulfport) | MS | $0.88 | $0.63 | $0.64 | $0.98 |
| Hinds County (Jackson) | MS | $0.75 | $0.53 | $0.50 | $0.77 |
| Missoula County (Missoula) | MT | $1.77 | $1.19 | $1.35 | $2.03 |
| Yellowstone County (Billings) | MT | $1.41 | $1.01 | $1.04 | $1.65 |
| Durham County (Durham) | NC | $1.23 | $0.81 | $0.87 | $1.32 |
| Forsyth County (Winston-Salem) | NC | $1.22 | $0.82 | $0.79 | $1.16 |
| Guilford County (Greensboro) | NC | $1.16 | $0.80 | $0.73 | $1.19 |
| Mecklenburg County (Charlotte) | NC | $1.24 | $0.76 | $0.86 | $1.34 |
| Wake County (Raleigh) | NC | $1.42 | $0.96 | $1.00 | $1.50 |
| Burleigh County (Bismarck) | ND | $1.41 | $0.98 | $1.16 | $1.67 |
| Cass County (Fargo) | ND | $1.32 | $0.91 | $1.06 | $1.56 |
| Douglas County (Omaha) | NE | $1.12 | $0.70 | $0.76 | $1.19 |
| Lancaster County (Lincoln) | NE | $1.23 | $0.82 | $0.87 | $1.31 |
| Hillsborough County (Manchester, Nashua) | NH | $1.56 | $0.90 | $0.87 | $1.34 |
| Essex County (Newark) | NJ | $2.45 | $1.30 | $1.18 | $1.82 |
| Hudson County (Jersey City) | NJ | $2.17 | $1.08 | $1.00 | $1.47 |
| Bernalillo County (Albuquerque) | NM | $1.42 | $0.90 | $0.89 | $1.31 |
| Doña Ana County (Las Cruces) | NM | $1.11 | $0.76 | $0.81 | $1.29 |
| Clark County (Henderson, Las Vegas, North Las Vegas) | NV | $1.75 | $0.60 | $0.95 | $1.33 |
| Washoe County (Reno) | NV | $2.19 | $0.80 | $1.17 | $1.68 |
| Erie County (Buffalo) | NY | $0.92 | $0.67 | $0.72 | $1.15 |
| Kings County (New York) | NY | $3.16 | $1.81 | $1.73 | $2.53 |
| Cuyahoga County (Cleveland) | OH | $1.15 | $0.65 | $0.63 | $0.97 |
| Franklin County (Columbus) | OH | $1.19 | $0.70 | $0.75 | $1.15 |
| Hamilton County (Cincinnati) | OH | $1.32 | $0.79 | $0.76 | $1.18 |
| Lucas County (Toledo) | OH | $1.11 | $0.61 | $0.58 | $0.92 |
| Oklahoma County (Oklahoma City) | OK | $0.95 | $0.66 | $0.69 | $1.08 |
| Tulsa County (Tulsa) | OK | $1.00 | $0.69 | $0.71 | $1.12 |
| Lane County (Eugene) | OR | $1.60 | $0.94 | $1.09 | $1.58 |
| Multnomah County (Portland) | OR | $1.87 | $1.09 | $1.18 | $1.70 |
| Allegheny County (Pittsburgh) | PA | $0.91 | $0.63 | $0.69 | $1.02 |
| Philadelphia County (Philadelphia) | PA | $0.84 | $0.60 | $0.62 | $0.88 |
| Providence County (Cranston, Providence) | RI | $1.84 | $0.93 | $0.95 | $1.49 |
| Charleston County (Charleston) | SC | $1.52 | $0.93 | $1.05 | $1.64 |
| Richland County (Columbia) | SC | $1.06 | $0.67 | $0.66 | $1.05 |
| Minnehaha County (Sioux Falls) | SD | $1.21 | $0.83 | $0.95 | $1.51 |
| Pennington County (Rapid City) | SD | $1.17 | $0.79 | $0.92 | $1.43 |
| Davidson County (Nashville) | TN | $1.18 | $0.76 | $0.93 | $1.34 |
| Shelby County (Memphis) | TN | $0.95 | $0.58 | $0.69 | $1.08 |
| Bexar County (San Antonio) | TX | $0.81 | $0.56 | $0.66 | $1.03 |
| Collin County (Plano) | TX | $1.16 | $0.75 | $0.88 | $1.41 |
| Dallas County (Dallas, Irving) | TX | $0.90 | $0.56 | $0.67 | $1.01 |
| El Paso County (El Paso) | TX | $0.89 | $0.59 | $0.55 | $0.94 |
| Harris County (Houston) | TX | $0.92 | $0.58 | $0.66 | $1.03 |
| Lubbock County (Lubbock) | TX | $0.73 | $0.53 | $0.61 | $0.94 |
| Nueces County (Corpus Christi) | TX | $0.71 | $0.50 | $0.54 | $0.89 |
| Tarrant County (Arlington, Fort Worth) | TX | $0.91 | $0.60 | $0.73 | $1.06 |
| Travis County (Austin) | TX | $1.22 | $0.86 | $1.08 | $1.56 |
| Webb County (Laredo) | TX | $0.85 | $0.56 | $0.60 | $0.99 |
| Salt Lake County (Salt Lake City, West Valley City) | UT | $1.53 | $0.95 | $1.17 | $1.74 |
| Chesapeake city (Chesapeake) | VA | $1.51 | $0.84 | $0.84 | $1.22 |
| Virginia Beach city (Virginia Beach) | VA | $1.36 | $0.82 | $0.78 | $1.15 |
| Chittenden County (Burlington, South Burlington) | VT | $1.47 | $1.01 | $0.89 | $1.37 |
| King County (Seattle) | WA | $2.39 | $1.23 | $1.41 | $2.10 |
| Spokane County (Spokane) | WA | $1.41 | $0.91 | $1.10 | $1.58 |
| Dane County (Madison) | WI | $1.54 | $0.98 | $0.96 | $1.47 |
| Milwaukee County (Milwaukee) | WI | $1.24 | $0.75 | $0.70 | $1.12 |
| Cabell County (Huntington) | WV | $0.91 | $0.68 | $0.60 | $0.94 |
| Kanawha County (Charleston) | WV | $0.92 | $0.57 | $0.53 | $0.86 |
| Laramie County (Cheyenne) | WY | $1.34 | $0.88 | $1.08 | $1.51 |
| Natrona County (Casper) | WY | $1.48 | $0.83 | $0.94 | $1.38 |
Reading the numbers
What the middle number means
A typical county is the one in the middle when all counties are lined up from lowest to highest. Counting each county once gives small counties as much weight as Los Angeles County. So the figures above count people instead: half of Americans in these counties live where the loan payment cost more compared with rent, and half where it cost less. Counted by county, the typical figure was $1.22 in 2006 and $0.75 in 2012.
Why we show the swing, not who wins
We report how far the cost of buying compared with renting moved, not whether buying beats renting. That answer depends on the down payment and on which home and which rent you compare.
Take Travis County, Texas, home of Austin, in 2012. With 20% down, the loan payment alone was $0.86 for each $1 of rent. With 3.5% down it was $1.04. So with the larger down payment it was below rent, and with the smaller one above. These leave out tax, insurance and upkeep. By 2024 it had risen to $1.56 or $1.88. Either way, the loan payment came to cost much more compared with rent.
Studies that compare different homes find different answers. In its 2025 report, using mostly 2024 prices and wages, ATTOM compared owning a median-priced home with renting a three-bedroom home, measured against local wages. It found owning cheaper in close to 60% of 341 counties. This study extends one-year snapshots like ATTOM's into a 20-year series for 759 large counties.
Does the result change under other choices?
We ran the study 12 ways: three down payments, with and without property tax, and two ways to value a home. In every version, buying got cheaper compared with renting in every county from 2006 to 2012. It got more expensive in every county from 2021 to 2024.
| Home value | Down payment | Property tax | Fell 2006 to 2012 | Typical fall | Rose 2021 to 2024 | Typical rise |
|---|---|---|---|---|---|---|
| Census survey value | 20% | Left out | 759 of 759 | −45% | 759 of 759 | +54% |
| Census survey value | 20% | Included | 759 of 759 | −39% | 759 of 759 | +40% |
| Census survey value | 10% | Left out | 759 of 759 | −45% | 759 of 759 | +54% |
| Census survey value | 10% | Included | 759 of 759 | −40% | 759 of 759 | +40% |
| Census survey value | 3.5% | Left out | 759 of 759 | −45% | 759 of 759 | +54% |
| Census survey value | 3.5% | Included | 759 of 759 | −40% | 759 of 759 | +41% |
| Carried by the FHFA index | 20% | Left out | 759 of 759 | −54% | 759 of 759 | +58% |
| Carried by the FHFA index | 20% | Included | 759 of 759 | −47% | 759 of 759 | +41% |
| Carried by the FHFA index | 10% | Left out | 759 of 759 | −54% | 759 of 759 | +58% |
| Carried by the FHFA index | 10% | Included | 759 of 759 | −48% | 759 of 759 | +42% |
| Carried by the FHFA index | 3.5% | Left out | 759 of 759 | −54% | 759 of 759 | +58% |
| Carried by the FHFA index | 3.5% | Included | 759 of 759 | −48% | 759 of 759 | +41% |
Method, sources and limits
- The payment
- Principal and interest on the county's median home value, with 20% down and a 30-year loan at that year's average rate on home purchase loans, from FHFA's National Mortgage Database. The average rate includes fixed and adjustable loans of different lengths. We apply it to a 30-year loan to compare years on the same footing. Property tax, insurance and upkeep are left out. So is the value an owner builds as the loan is paid down.
- The rent
- The county's median gross rent, which includes utilities. Home value and rent come from the Census Bureau's American Community Survey. We average each survey year with the years on either side. The first and last years use two. There is no 2020 survey, so 2019 and 2021 are neighbours.
- Home prices compared with local wages
- FHFA's house price index for the county divided by the average wages of jobs in the county from the Bureau of Labor Statistics. Both start at 100 in 2000. At 120, home prices are 20% higher compared with local wages than in 2000.
- What's left out
- The yearly survey covers counties with 65,000 people or more. We kept the 759 it covers every year, home to 83% of Americans in 2025. Connecticut is left out because its counties were replaced with planning regions in 2022. New York County is left out because the price index skips seven of its years.
- 2020
- There is no 2020 point. The Census Bureau did not release its usual yearly figures for 2020 after the pandemic disrupted the survey.
- Inflation
- Both measures are ratios of dollars from the same year, so inflation cancels out and no adjustment is needed.
Data through 2025. Built November 4, 2026.
Use the data
All 759 counties, every year from 2005 to 2025 except 2020, free to reuse with a link to this page (CC BY 4.0).
Every release, with the input files and their fingerprints, is also on GitHub.
Download the dataCite this study
PriceDNA, “Mortgage payments vs. rent: two big swings in 20 years,” 759 US counties, 2005 to 2025, November 2026. https://www.pricedna.co/research/mortgage-payments-vs-rent/
Get our next study by email
Optional. Unsubscribe anytime.
Methodology and data
Besides Connecticut and New York County, 91 counties are left out because they were missing from at least one yearly survey. The download lists every county in the study.
Data and reproducibility
Every input is a public file. We keep the exact copy we used, with a SHA-256 fingerprint: a code that changes if even one byte of the file changes. The files and their fingerprints are on GitHub, so anyone can check that the data behind each figure has not changed. A fingerprint shows the files have not changed. It does not prove the math.
| Source | Data | Released | Retrieved | SHA-256 |
|---|---|---|---|---|
| Census | American Community Survey 1-year, 20 years, and the 2025 US total | Not stated | November 4, 2026 | In the full list |
| FHFA | House Price Index, counties, annual | March 31, 2026 | October 3, 2026 | 534e9fd3… |
| FHFA | National Mortgage Database, average rate on home purchase loans | Not stated | September 24, 2026 | 88d91278… |
| BLS | Quarterly Census of Employment and Wages, average wages, 26 years | Not stated | November 4, 2026 | In the full list |
| OMB | Metro area definitions, 2023 | Not stated | October 3, 2026 | 952c4b1e… |
The full list, with every fingerprint, is in pricedna-mortgage-payments-vs-rent-sources.json, published with the data download.
History, not a forecast: past swings do not say what a county will do next. PriceDNA is for education and information only. It is not an appraisal or investment advice.